Your cart is currently empty!

Vibration registration and evaluation
The system is for vibration level recording on one or two transducers detecting vibration in three axes. That is, recording on a maximum of 6 channels for a selected duration. The signal is pre-amplified with an amplifier BK containing a switchable low-pass filter with a limit frequency of 10 kHz. The signal is further conditioned by a programmable low pass filter with the selectable limit frequency between 2 and 8 kHz or a band filter with of lower frequency of 4 Hz and selectable upper frequency between 2 and 8 kHz. The selected number of waveforms is measured and recorded, from which the average is calculated at the end. Peak and effective acceleration values are calculated from the record. The measurement protocol is printed according to the prescribed pattern in the Czech or English language. The data are stored on the computer disk, and the system allows for additional reading and evaluation. When evaluating the data, it is possible to eliminate edge values using the Bosch Peak method.
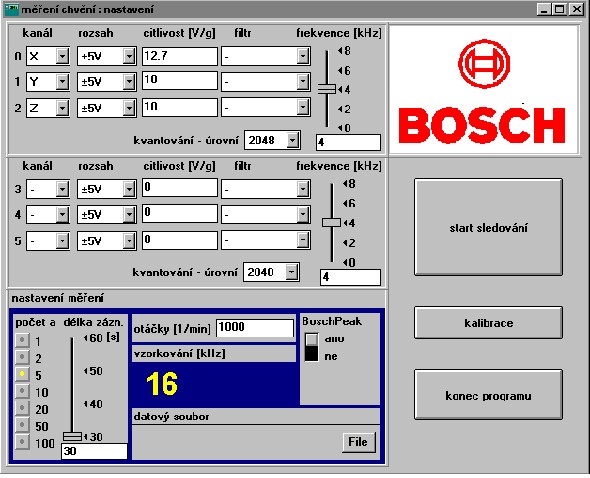
The program automatically ensures that the operator does not select a “nonsense” input, such as the same axis on two channels. In addition to “common” measurement parameters such as sample rate, filter settings, recording length, and so on, the measuring program also allows the selection of input range and number of converter quantification levels. The operator can manually adjust the amplifier gain before measuring; in doing so, it is assisted by a measuring program that displays both the measured value (both RMS and peak value) as well as underflow or overflow range information.
The measured values are displayed in several formats after the measurement. It is possible to display the time course, indeed. It is also possible to display spectrum, power density, or acceleration histogram. Each chart window is equipped with an Inspect button. The graph can be zoomed (scaled), printed on a printer, or transferred via the clipboard to another program (e.g., a text editor) to incorporate the graph into any report. Double-clicking a curve changes properties (such as curve colors) or even modifies it (manually changing the X and Y axes).
The program is prepared in the TestPoint development environment.
The input window looks as follows:
More information request here.